What to Look for If Your Website Speed is Slow?
What to Look for If Your Website Speed is Slow?

Your website speed plays a crucial role in the success of your business as it affects the visibility of your website in search engines, user experience, and conversion rate.
Therefore, it’s important to identify and fix the issues that slow down your website loading speed.
Unfortunately, there are many different factors that determine a website’s performance or loading speed, which makes it difficult for non-web developers to identify and fix the problems.
In this blog, we break down the various speed metrics used to analyze website speed, so that you exactly know what to look for when your website speed is slow.
Website Speed Testing Tools
There are many tools to measure the loading speed of a web page. Additionally, they break down each stage in the loading process and show the time they take. All you need to do is enter the URL of the web page you want to measure the speed of.
Some of the trusted and popular tools are the following.
After you input the URL of the web page, the tool will generate a report which will include
- various web page loading metrics
- score or grade for the performance
- suggestions to improve speed
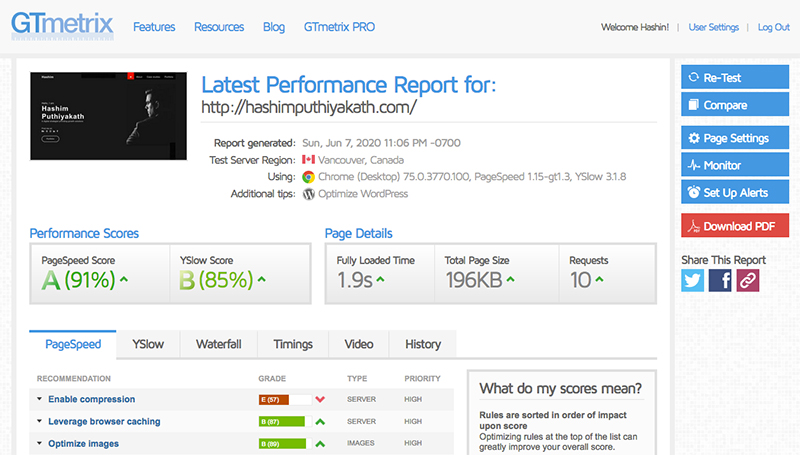
Web page speed test results from GTmetrix
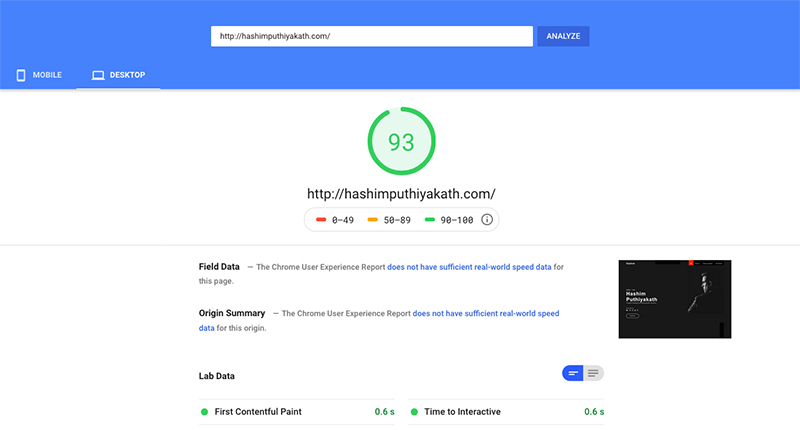
Web page speed test results from Google Page Speed Insights
When you use speed testing tools, you should remember each of them may show slightly different results. Sometimes the same tool will show different results for the same page when you check multiple times.
The result may vary based on the server location and speed testing tool.
So, when you use the speed testing tool, stick to one tool and server location.
Moreover, it is also a good idea to check the speed multiple times and consider the fastest loading time.
Important Website Speed Metrics
Keep in mind, web page loading is not a single activity. There are many stages or moments in the page loading process and it’s important to break them down and analyze each one to identify what makes your website load slower.
Most of the speed testing tools breakdown the web page loading process and present the analysis in a user-friendly way. The various terms and metrics may sound complex at first but once you understand what they are, you can understand the analysis very well and pinpoint the reasons that slow down your website.
In this blog, we use GTmetrix tool and Google PageSpeed Insights to analyze the website speed loading.
In GTmetrix, you may need to create a free account to get a detailed analysis.
TTFB – (Time to First Byte)
TTFB is the time duration from a user requesting a web page to receiving the first byte (piece of data) in the browser.
In simple words, it is the time a web page takes to start loading in a browser after the user entering the website address.
TTFB is made up of three components.
- HTTP request time
- Process request time
- Response time
If your website has a shorter TTFB, your page will be loaded faster.
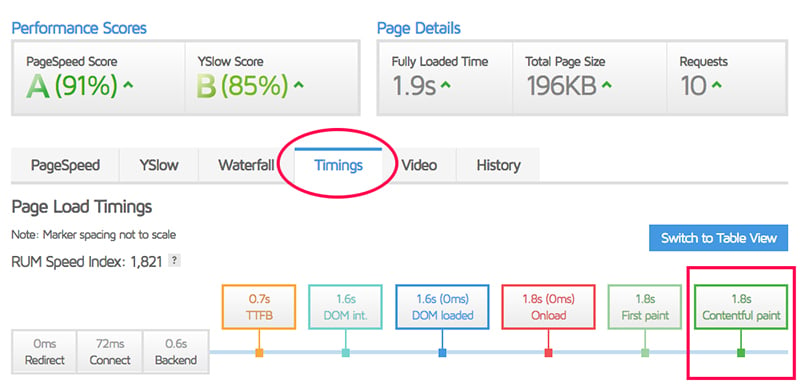
You can measure the TTFB of your website using the GTmetrix tool. In the result page, click on the Timings tab to view TTFB.
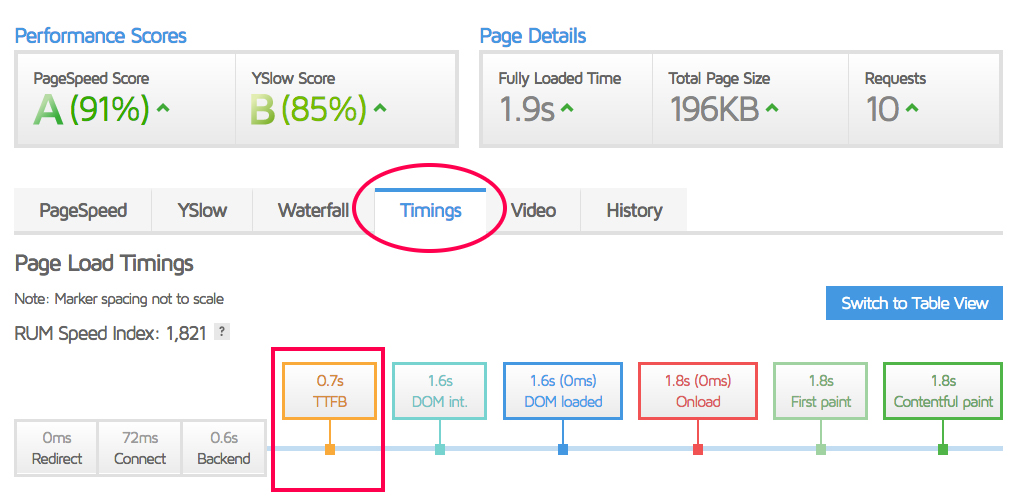
In this example, TTFB is 0.7 seconds (700ms) which is really high.
You should aim for less than 200ms TTFB.
200ms to 400ms is okay.
If your number is above 400ms, you need to take steps to improve the speed. The common factors that affect slow TTFB are the following.
- Poor server configuration
- Poor database design / Slow content creation
- Inefficient code
- Issues with network
- Huge website traffic
First Paint
First paint refers to the time a page takes to render (show) the first pixel on the screen. Most of the time it would be the background color.
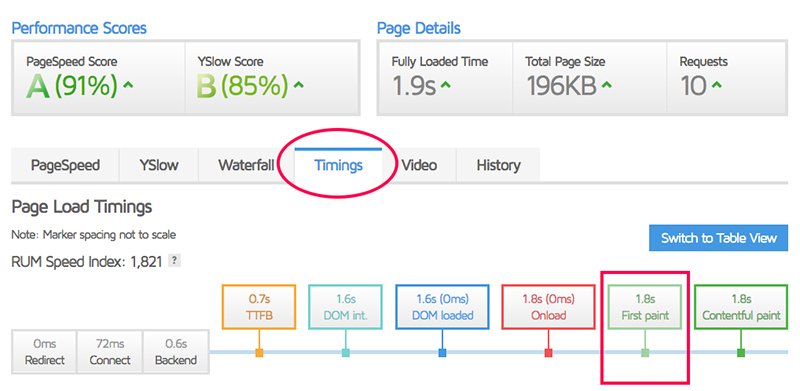
Until the first paint, users will have no clue if the page is actually loading, and the first paint gives feedback to the user that the page has actually started loading.
First Contentful Paint
The first contentful paint metric signifies the time a web page takes to show the first actual content on the website. The content could be text, image, or other graphical elements.
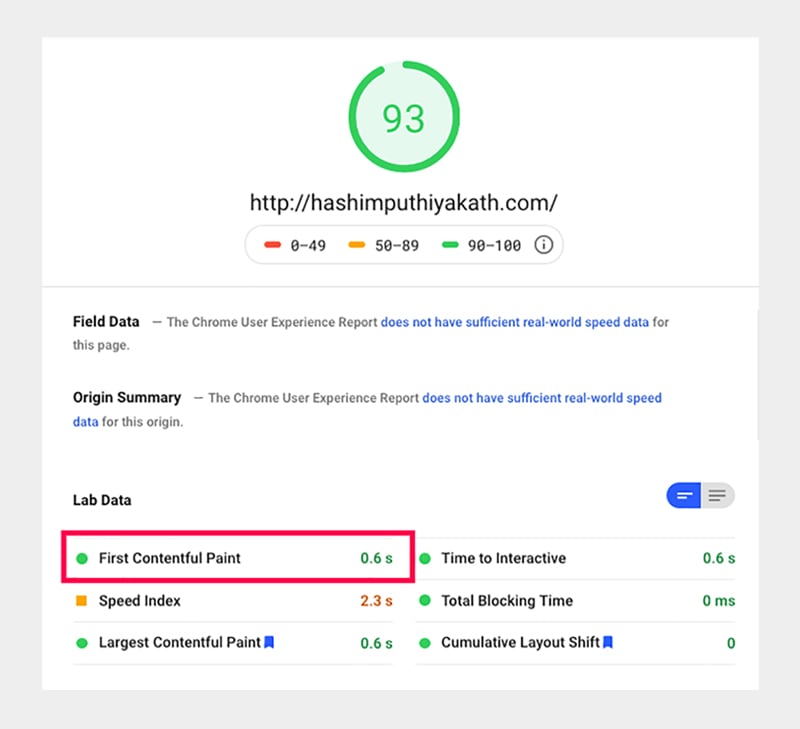
Generally, for most of the websites, the time for first paint and first contentful paint would be the same because they are closely aligned.
First Meaningful Paint
First meaningful paint is the time a page takes to show the first primary content on the screen and load the web fonts.
A web page may load the header and navigation first but this is not counted in the first meaningful paint.
The first meaningful paint only counts the rendering (display) of primary content.
- In a search result page, the search result item is the primary content
- In a blog post, the title and text above the fold are the primary conten
- In an ecommerce product page, the product image is the primary content
However, you should understand that not all website speed analysis tools measure first meaningful paint accurately all the time. So, you may have to look for this manually in the developer tools provided by the browsers.
Time to Interactive
Time to interactive refers to the time a page takes to render the page on the screen and to be interactive. At this stage, the user should be able to scroll the page, click on a link, and right-click on any element if the right-click is not disabled.

At this stage,
- The page has displayed content.
- Event handlers are registered for the page elements.
- Page responds to user interactions such as scroll and clicks within 50ms.
Time for Full Load
The full load is essentially the rendering (display) of 100% assets on the web page. At this point, the page is fully loaded and there is no network activity.
You can use the webpagetest.org tool to find out the time for full load.

As you can see, in this example, the time for full load is 2.06 seconds.
Number of HTTP Requests
While loading a web page, the browser makes separate HTTP requests for each file required for the page. As the number of files (HTML, CSS, Javascript, fonts, and images, etc.) increases, the number of HTTP requests and page loading time also increase.
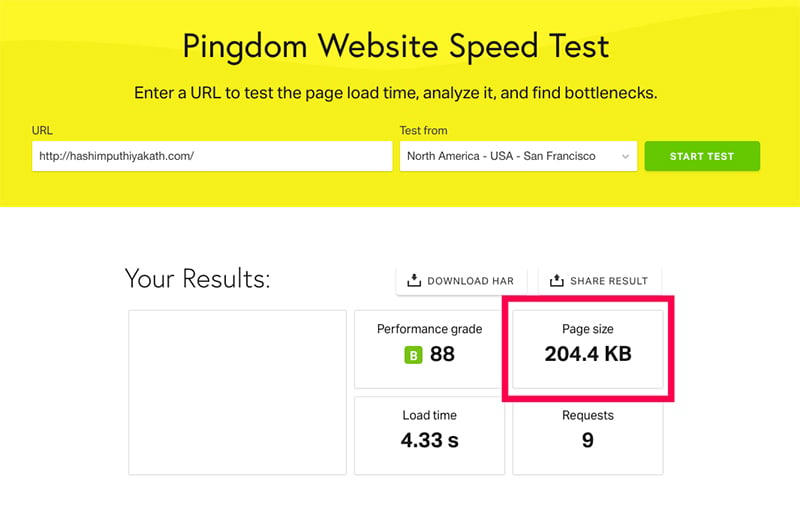
You can use the Pingdom Tools to find out the total number of HTTP requests for your page.

As you can see, the number of HTTP requests for this page is 9.
Total Page Size
Total page size is the total size of all elements and assets on a web page and it includes HTML, CSS, and Javascript files, images, fonts, and third-party domains, etc.
As the size of the web page increases, the loading time also increases.
You can use the Pingdom Tools to measure the document size of any web page.
Page Loading Metrics: Summary
Given the list of various web page performance metrics, you can see that there is no single metric to summarize the performance characteristics of a page. So, you need to pay attention to each one of them or at least to the three most important metrics: TTFB (time to first byte), FCI (first contentful paint), and TTI (time to interactive).
Other factors to look for when page speed is slow
Apart from the page loading or performance metrics, there are many other things that you can look for to identify what makes your website slow.
Bigger Files
The file size of the resources also affects the loading speed of a web page. So, you should take steps if there are unusually large resources.
Large Images
In most ecommerce websites, images contribute the most to the page size. So, if your web page loading speed is slow, it’s a good idea to check the file size of each image on a page.
Ideally, the maximum file size for an image on a web page is 100 kb. If there are images with more than 100 kb file size, you can resize and compress them to keep them under 100 kb.
Please remember that the 100 kb benchmark is for large images. So, a 90 kb file size should be considered too much for a small thumbnail image.
Third-party Domains
Sometimes you may have third-party content on your website that is hosted in other domains.
- Videos embedded from YouTube
- Gravatar images
- Social media widgets
Adding content from third-party domains like embedding videos from YouTube can be useful but not all third-party domains may not be fast. It could affect your page’s loading time.
So, you need to check for if there are any HTTP requests to third-party domains that take a long time and take actions to avoid it.
Summary
The loading speed of a web page depends on a variety of factors. You need to have an idea of them to identify the root causes that make your website’s loading speed slow so that you can fix them. Ultimately, we hope that this blog helped you to understand the various website performance metrics that you come across while testing the page loading speed of your website.
Want to experience what trusted eCommerce support feels like? Sign Up For A Trial
 Shares